

 Zyntra OS
 Zyntra Legal
 Zyntra Real Estate
 Zyntra Hotel
 Zyntra E-commerce
 Zyntra Appointments
 Zyntra Repair
 Zyntra Garage
 Zyntra Concierge
 Zyntra Contracting
 Zyntra Clinic
 Zyntra Dental
 Zyntra School
 Zyntra University
 Zyntra Call Center
 Zyntra OTA
Where
Manufacturing › Control chartsWho
«Read inspections and control charts».Read a chart
1
Choose the Measured check (each plan's measure lines are listed with how many subgroups they have), and if you like a From and To day.
2
The figures above: what is Allowed, how many Subgroups and of how many readings, the centre X̿ with its two limits, the average range R̄ with its limits, how many points are Out of control, and the capability Cp · Cpk against the allowed least and most.
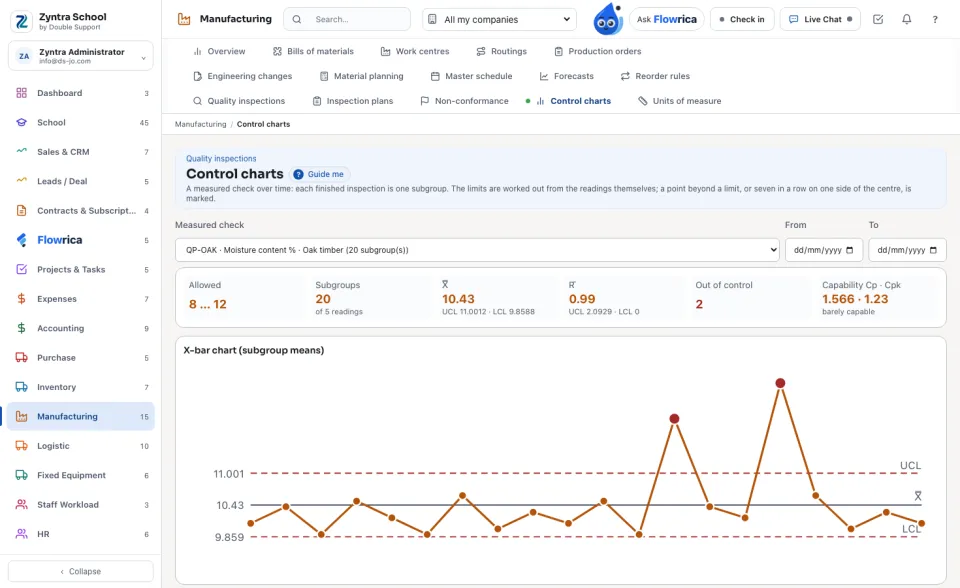
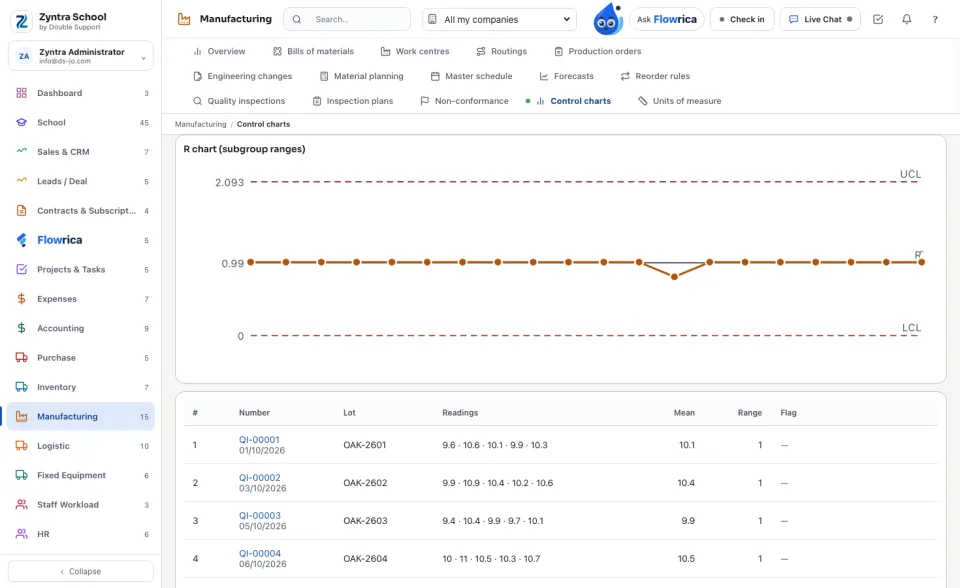
The X-bar chart draws each subgroup's mean against the centre and its limits (X̿ ± A2·R̄); the R chart draws each subgroup's range against R̄ and its limits. The limits are worked out from the readings themselves. A subgroup of one reading is drawn as individuals and moving ranges.
What is marked
A point is red when its mean or its range is beyond its limit, or when it is one of seven in a row on one side of the centre. The table under the charts lists every subgroup with its readings, mean, range and why it is marked; a number opens its inspection.
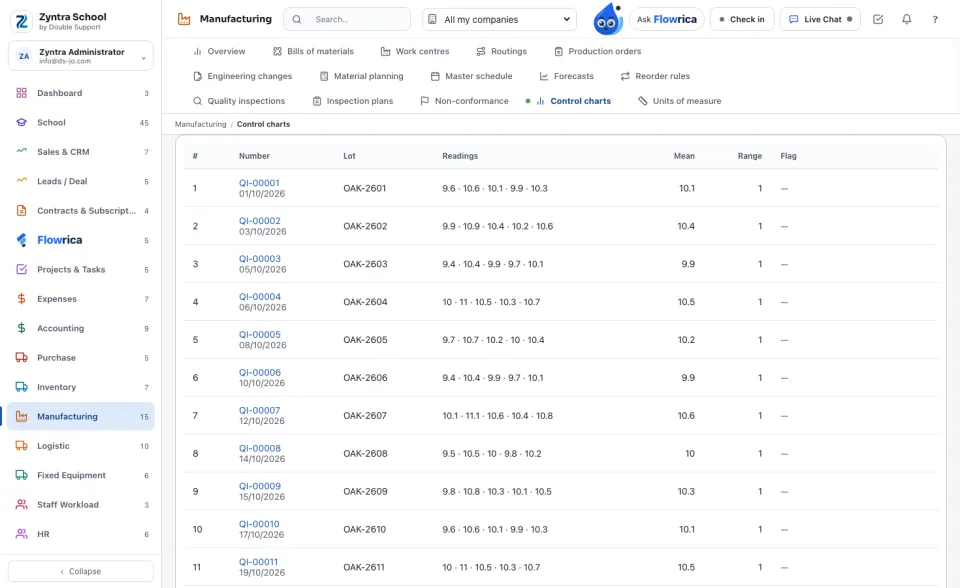
Five readings a lot make a steady chart: set them in the plan's Readings of each measure.
Questions
Where is “Control charts” in Zyntra OS?
Manufacturing › Control charts
Who can use “Control charts”?
«Read inspections and control charts».